They Asked for More Filters. They Needed a Decision Tool.
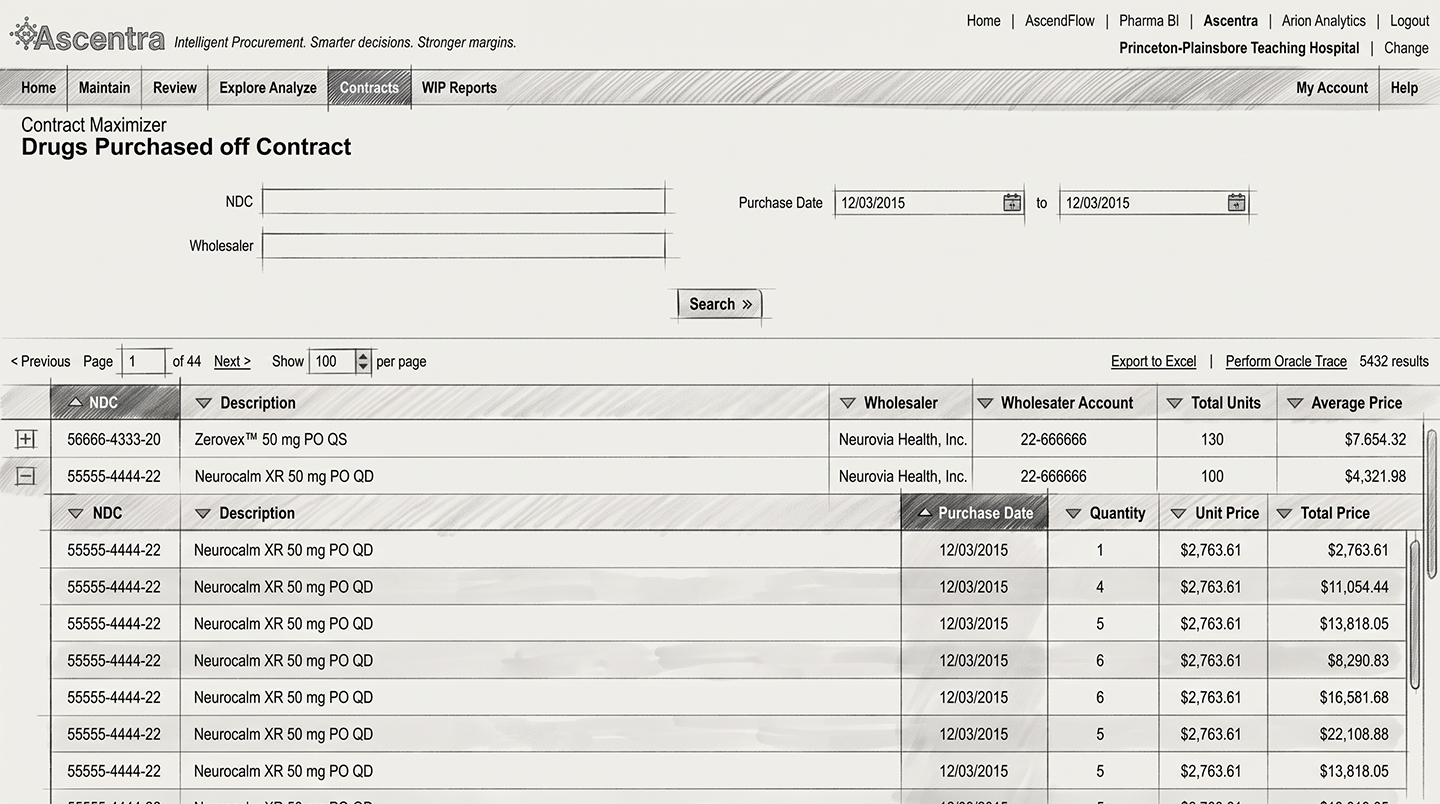
A healthcare analytics platform serving pharmacies and hospital systems. Its contract compliance reporting was meant to show where buyers were being billed above contracted rates, and what that overspend was costing them. It couldn't. The report rendered dense, unformatted tables that made discrepancies almost impossible to read. Users could retrieve data. They couldn't interpret it.
So they left. Into Excel, every time.
Product leadership's answer was to add more filters. That was the brief I was handed.
Caption: Legacy contract report table relying on dense, unformatted rows that forced users to export data into external spreadsheets. (UI recreated and data sanitized to protect proprietary information).
Session recordings and heatmaps told a different story. The busiest control on the page was the export button.
Users ran report after report, widened their queries, got inconsistent results, and dumped everything into spreadsheets to work out what mattered. They weren't searching badly. The interface handed them a wall of numbers and no way to tell which ones were a problem.
The real question wasn't "how do we filter better." It was "why are they taking the data somewhere else to think?"
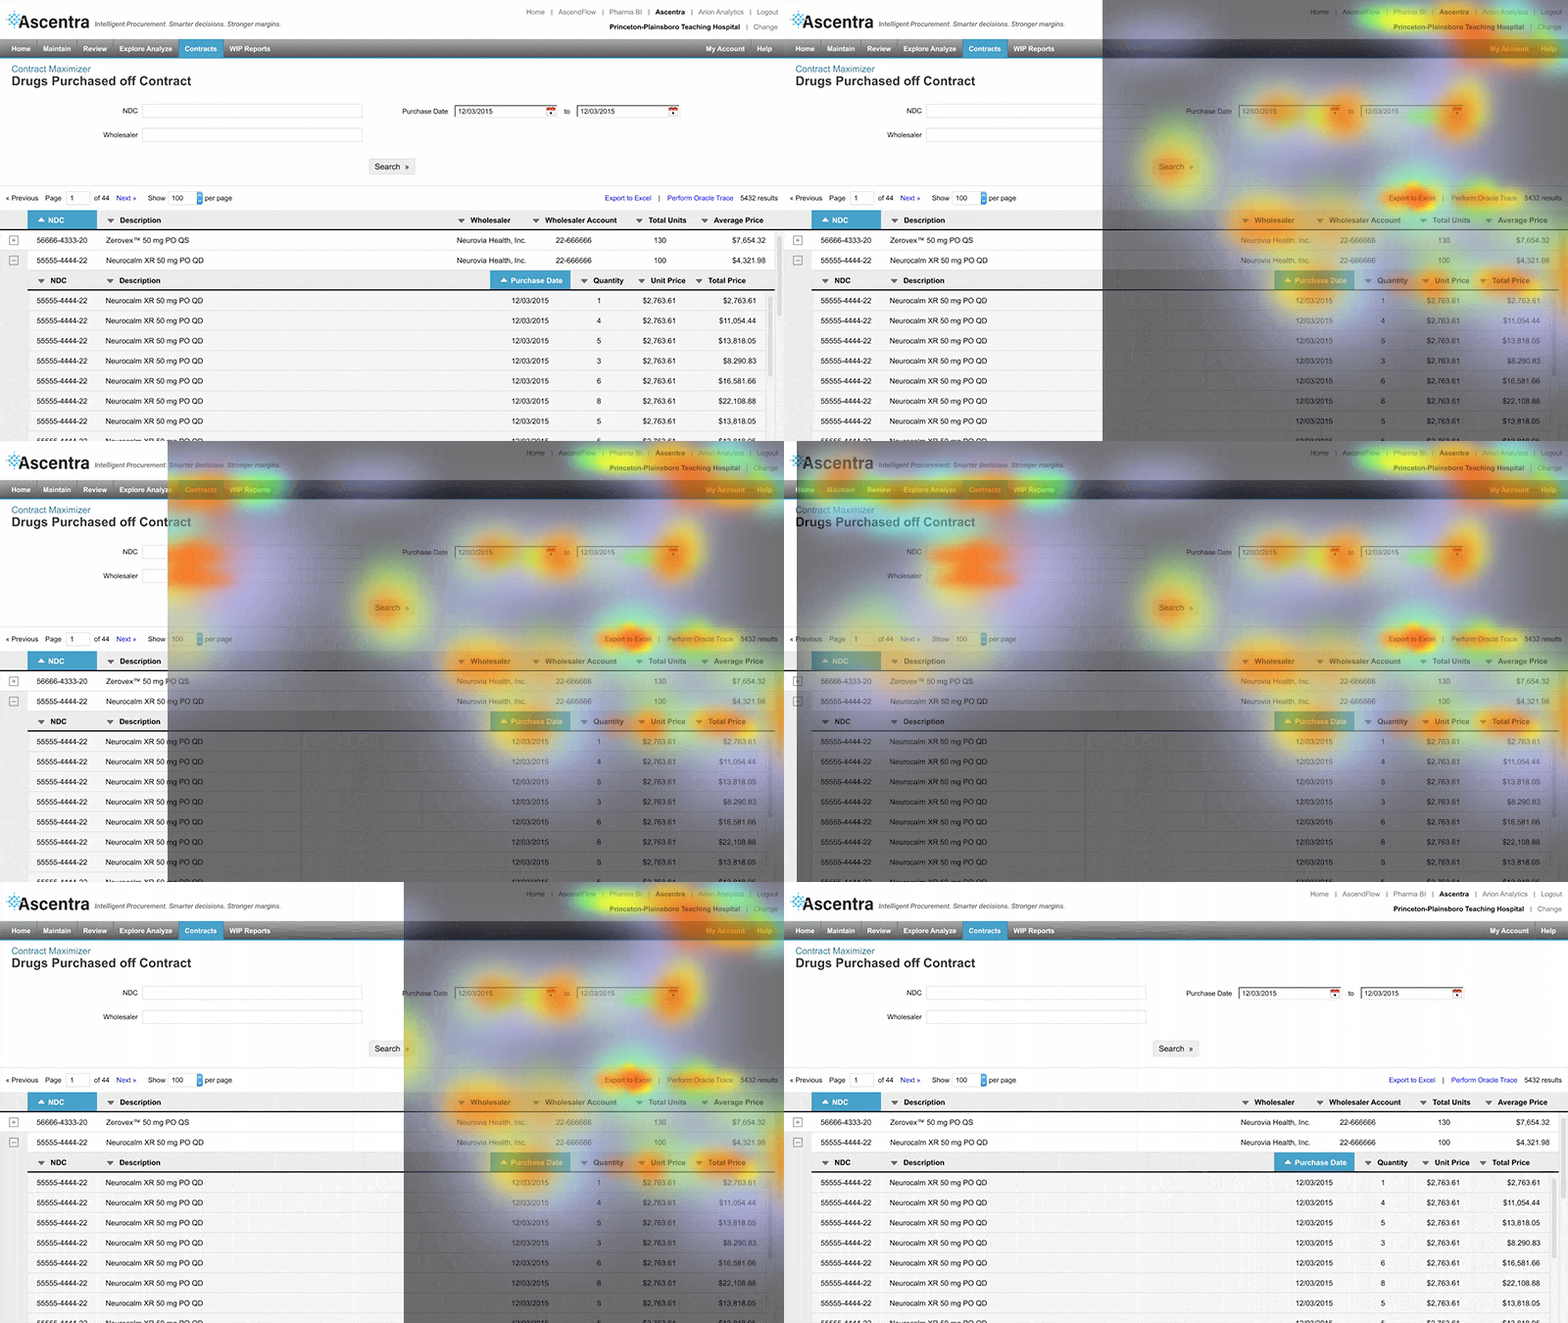
Caption: Session recordings and heatmaps highlighted repeated interaction with the export control, prompting further investigation into how users worked with report results.
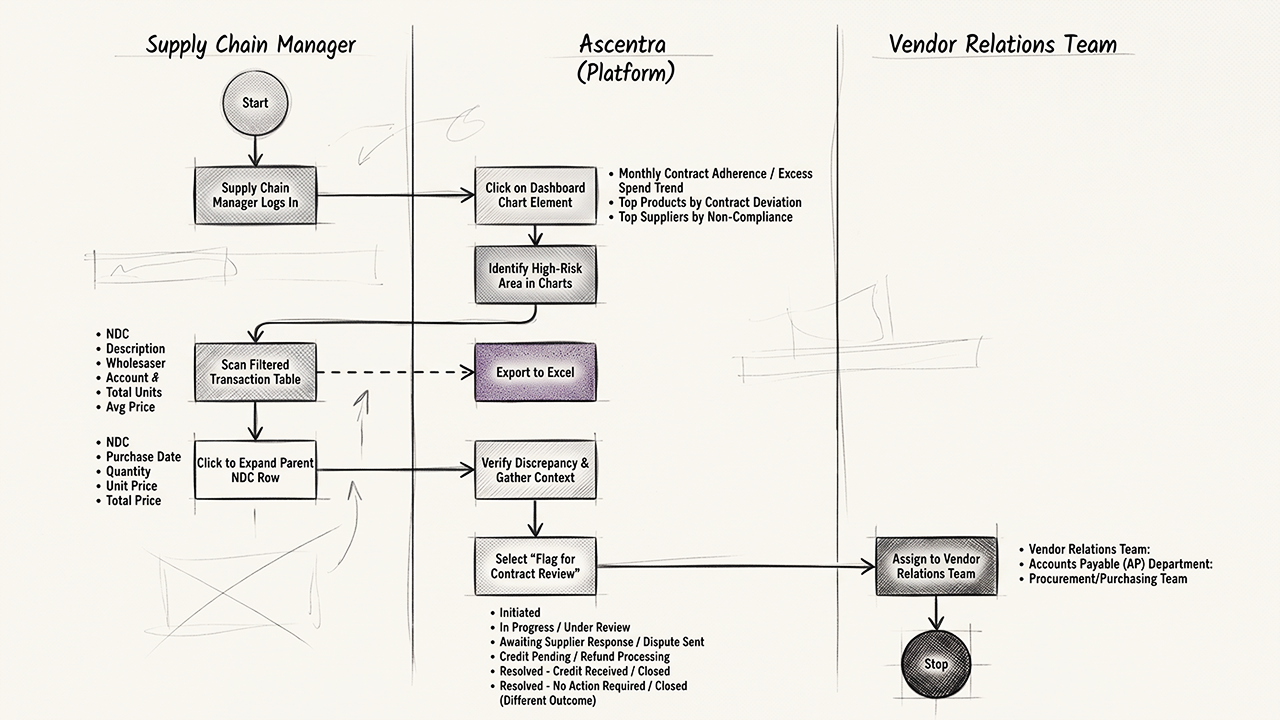
The design challenge was to go beyond refining search and make the financial implications of report results clearer and more actionable.
To align user needs with business objectives and data requirements, I worked cross-functionally with:
- Data analysts: Mapped how excess spend was calculated and identified the most relevant metrics.
- Supply chain SMEs: Clarified contract enforcement workflows and decision points.
- Product manager: Aligned design priorities with business goals, including cost reduction and supplier accountability.
This discovery informed the direction of the redesign: surface the most relevant financial information first, then help users investigate individual records and determine next steps.
I redesigned the reporting experience around a summary-first dashboard rather than a table-first layout. The goal was to provide financial context before presenting the underlying records.
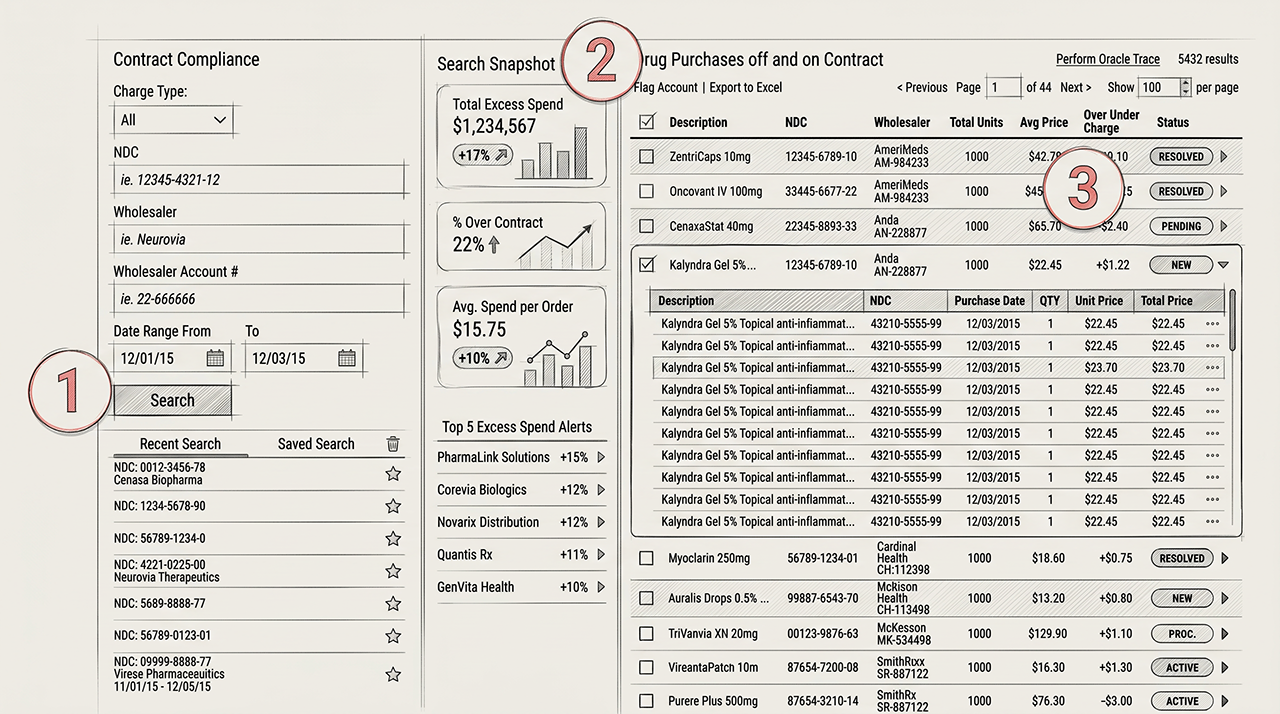
The proposed dashboard included:
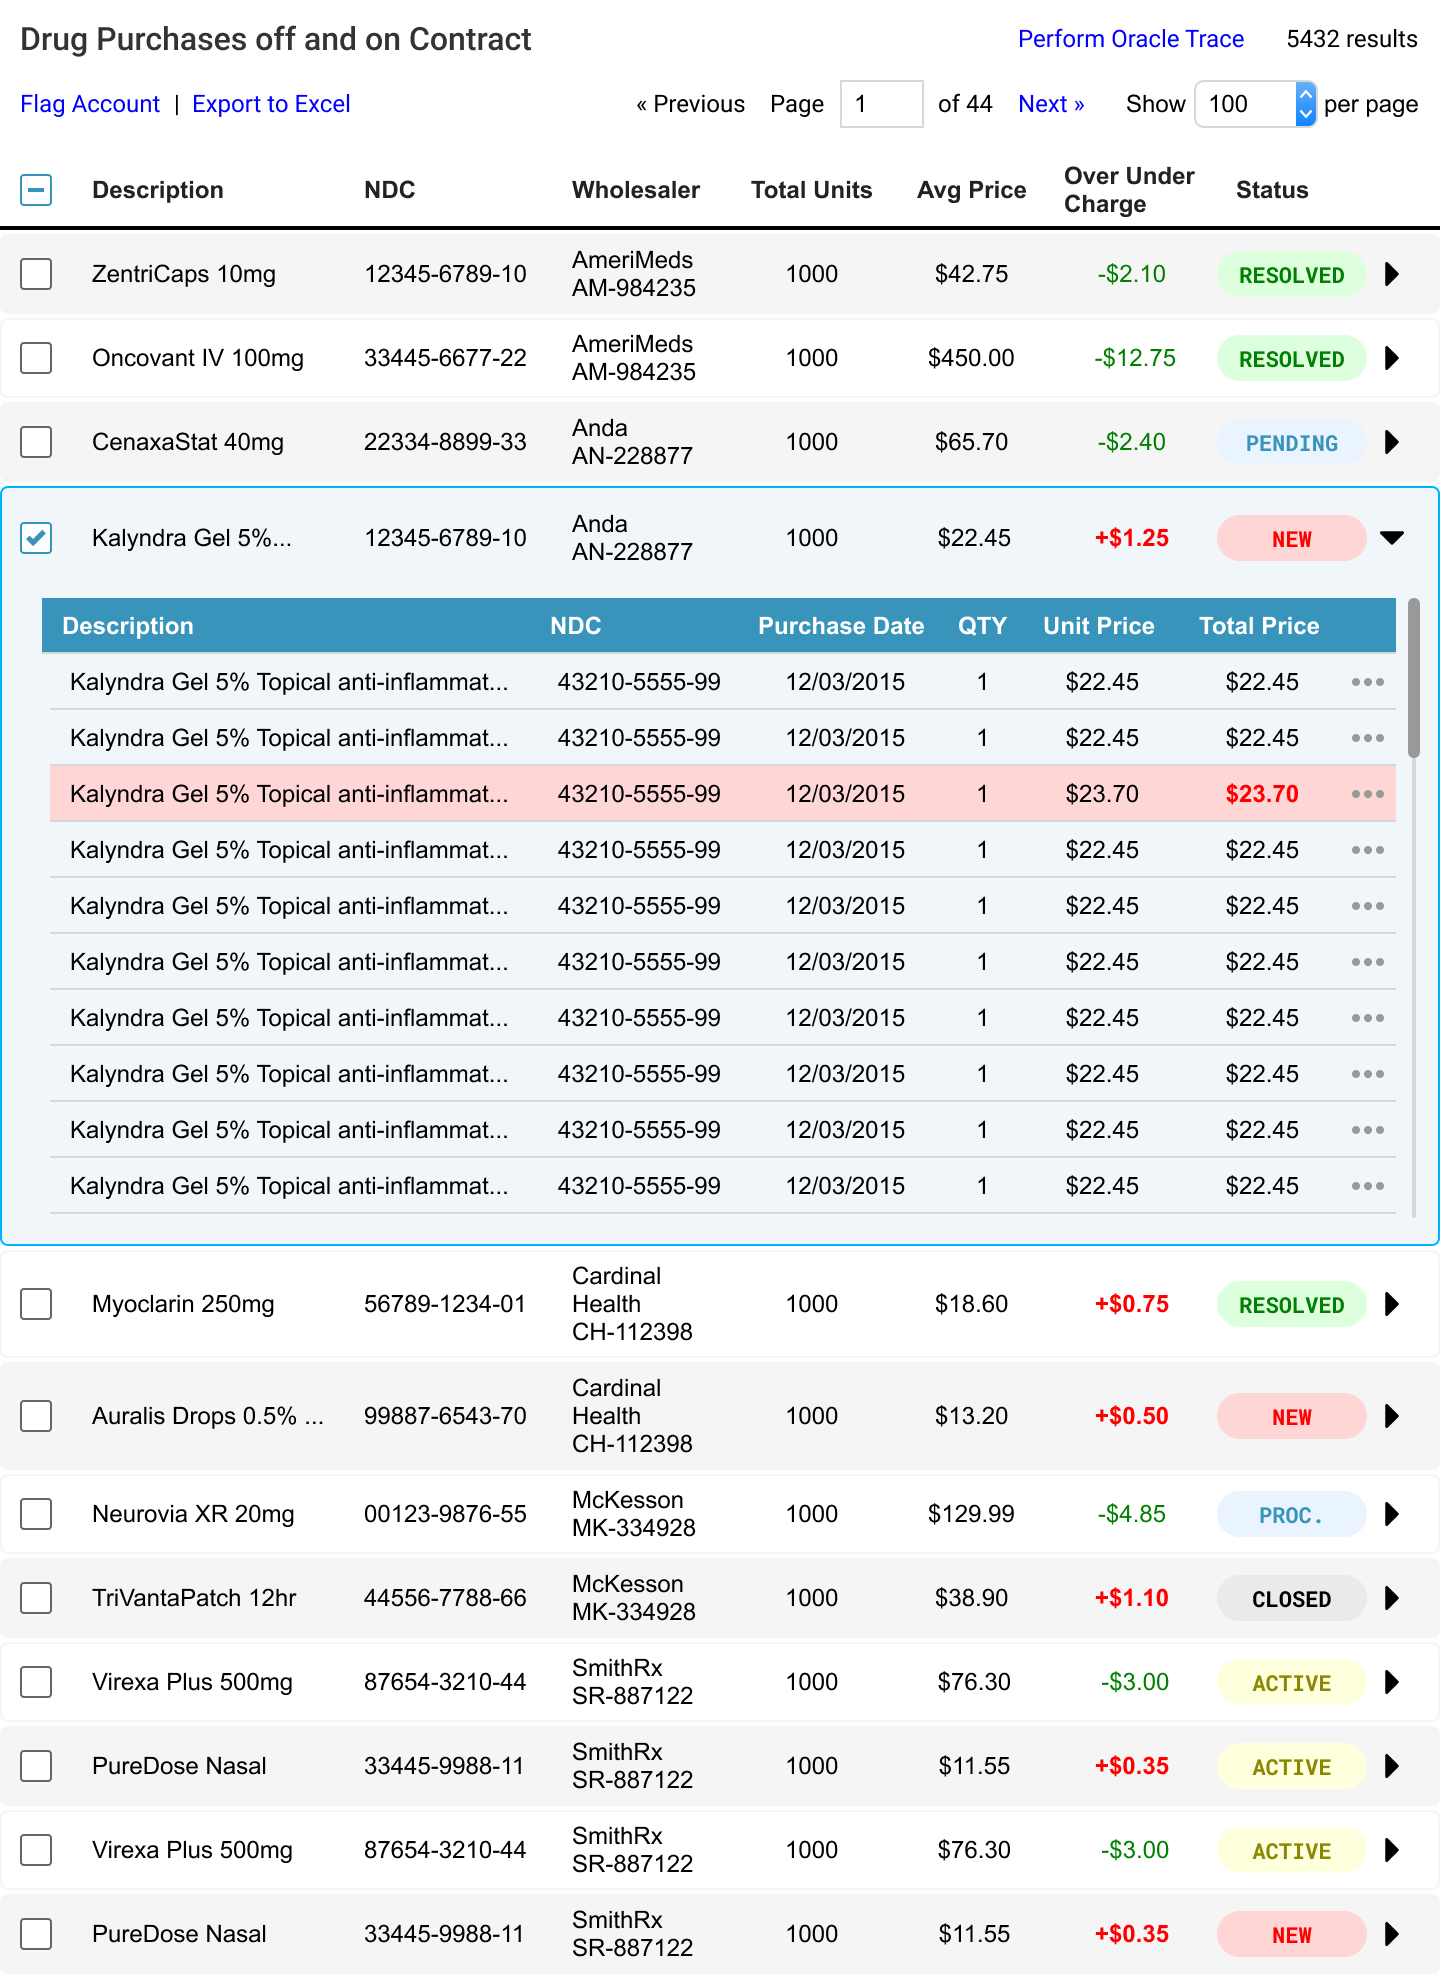
- Key financial KPIs: Total Excess Spend, Average Excess per Order, and Percentage Over Contract.
- Dynamic visualizations: Charts designed to reveal patterns and trends in the report results.
- Top 5 overspent accounts: A prioritized view of accounts with the highest excess spend.
Two things made this hard.
The first was the data. Thousands of contract line items sitting in legacy databases. I worked with backend engineers to sequence what loaded when: summary metrics first, detail after, skeleton states in between. Responsiveness traded against a data layer nobody could speed up.
The second was bigger. The redesign kept getting stopped. Federal reimbursement rules moved, Congress passed changes, and each shift changed what the reports had to show. The work went on hold more than once. Every restart meant re-validating assumptions that had quietly expired.
What was important was that the interactive, end-to-end prototype gave product leadership and engineering a concrete way to evaluate the proposed workflow in the context of daily procurement operations.
The project reframed contract reporting from a data retrieval problem into a decision-support challenge. Rather than adding more ways to filter dense tables, I explored how financial summaries, prioritized discrepancies, and proposed follow-up actions could help users make better use of the information already available.
The prototype was handed off for further development and stakeholder evaluation. Although the team later tested the design with its own clients and users, I can't attribute specific changes in export behavior, task completion time, or business performance to my work.
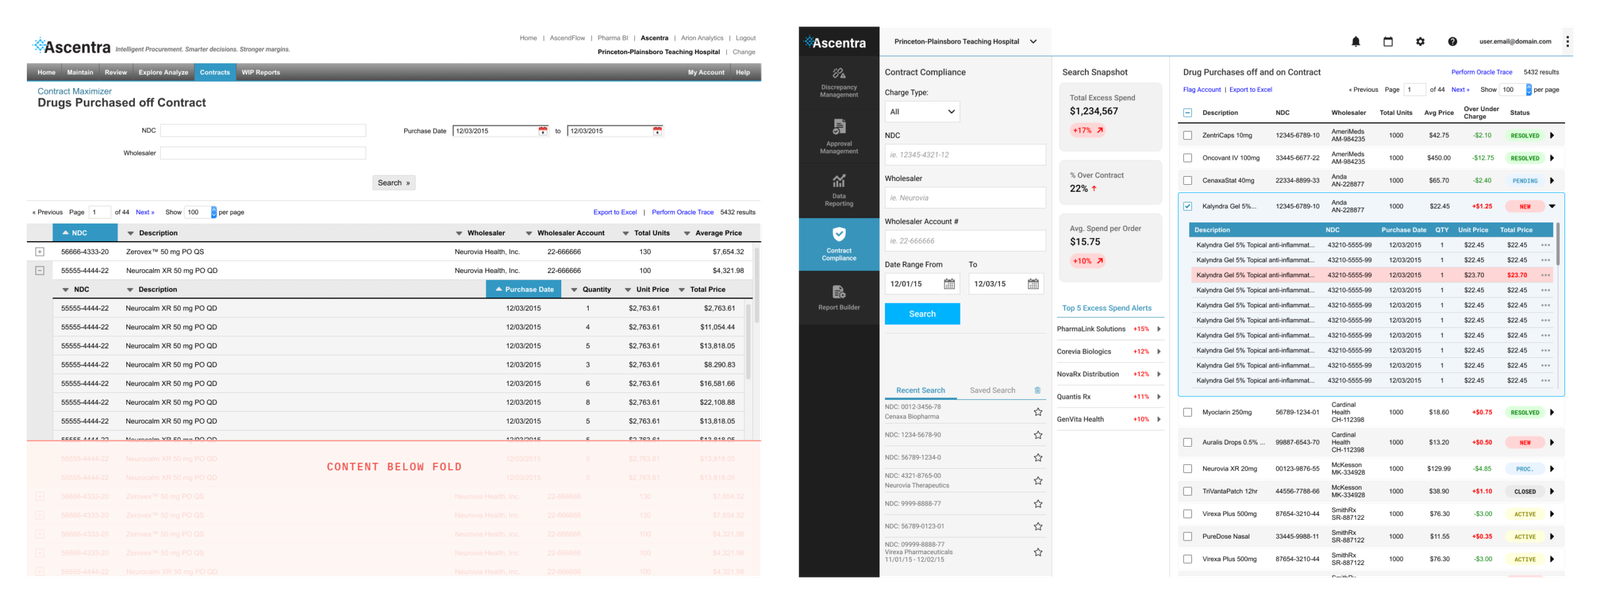
Caption: Before (left) and after (right) dashboard redesign.